Visualization 1
2차원 시각화
2차원 그래프는 trend, comparison, numerical output을 확인할 때 가장 기본이 되는 시각화입니다.
필요한 라이브러리 설치
Matplotlib이 설치되어 있지 않다면 먼저 설치합니다.
Windows PowerShell에서는 다음 명령어를 사용합니다.
py -m pip install matplotlib
macOS 또는 Linux에서는 다음 명령어를 사용합니다.
python3 -m pip install matplotlib
최소 예제
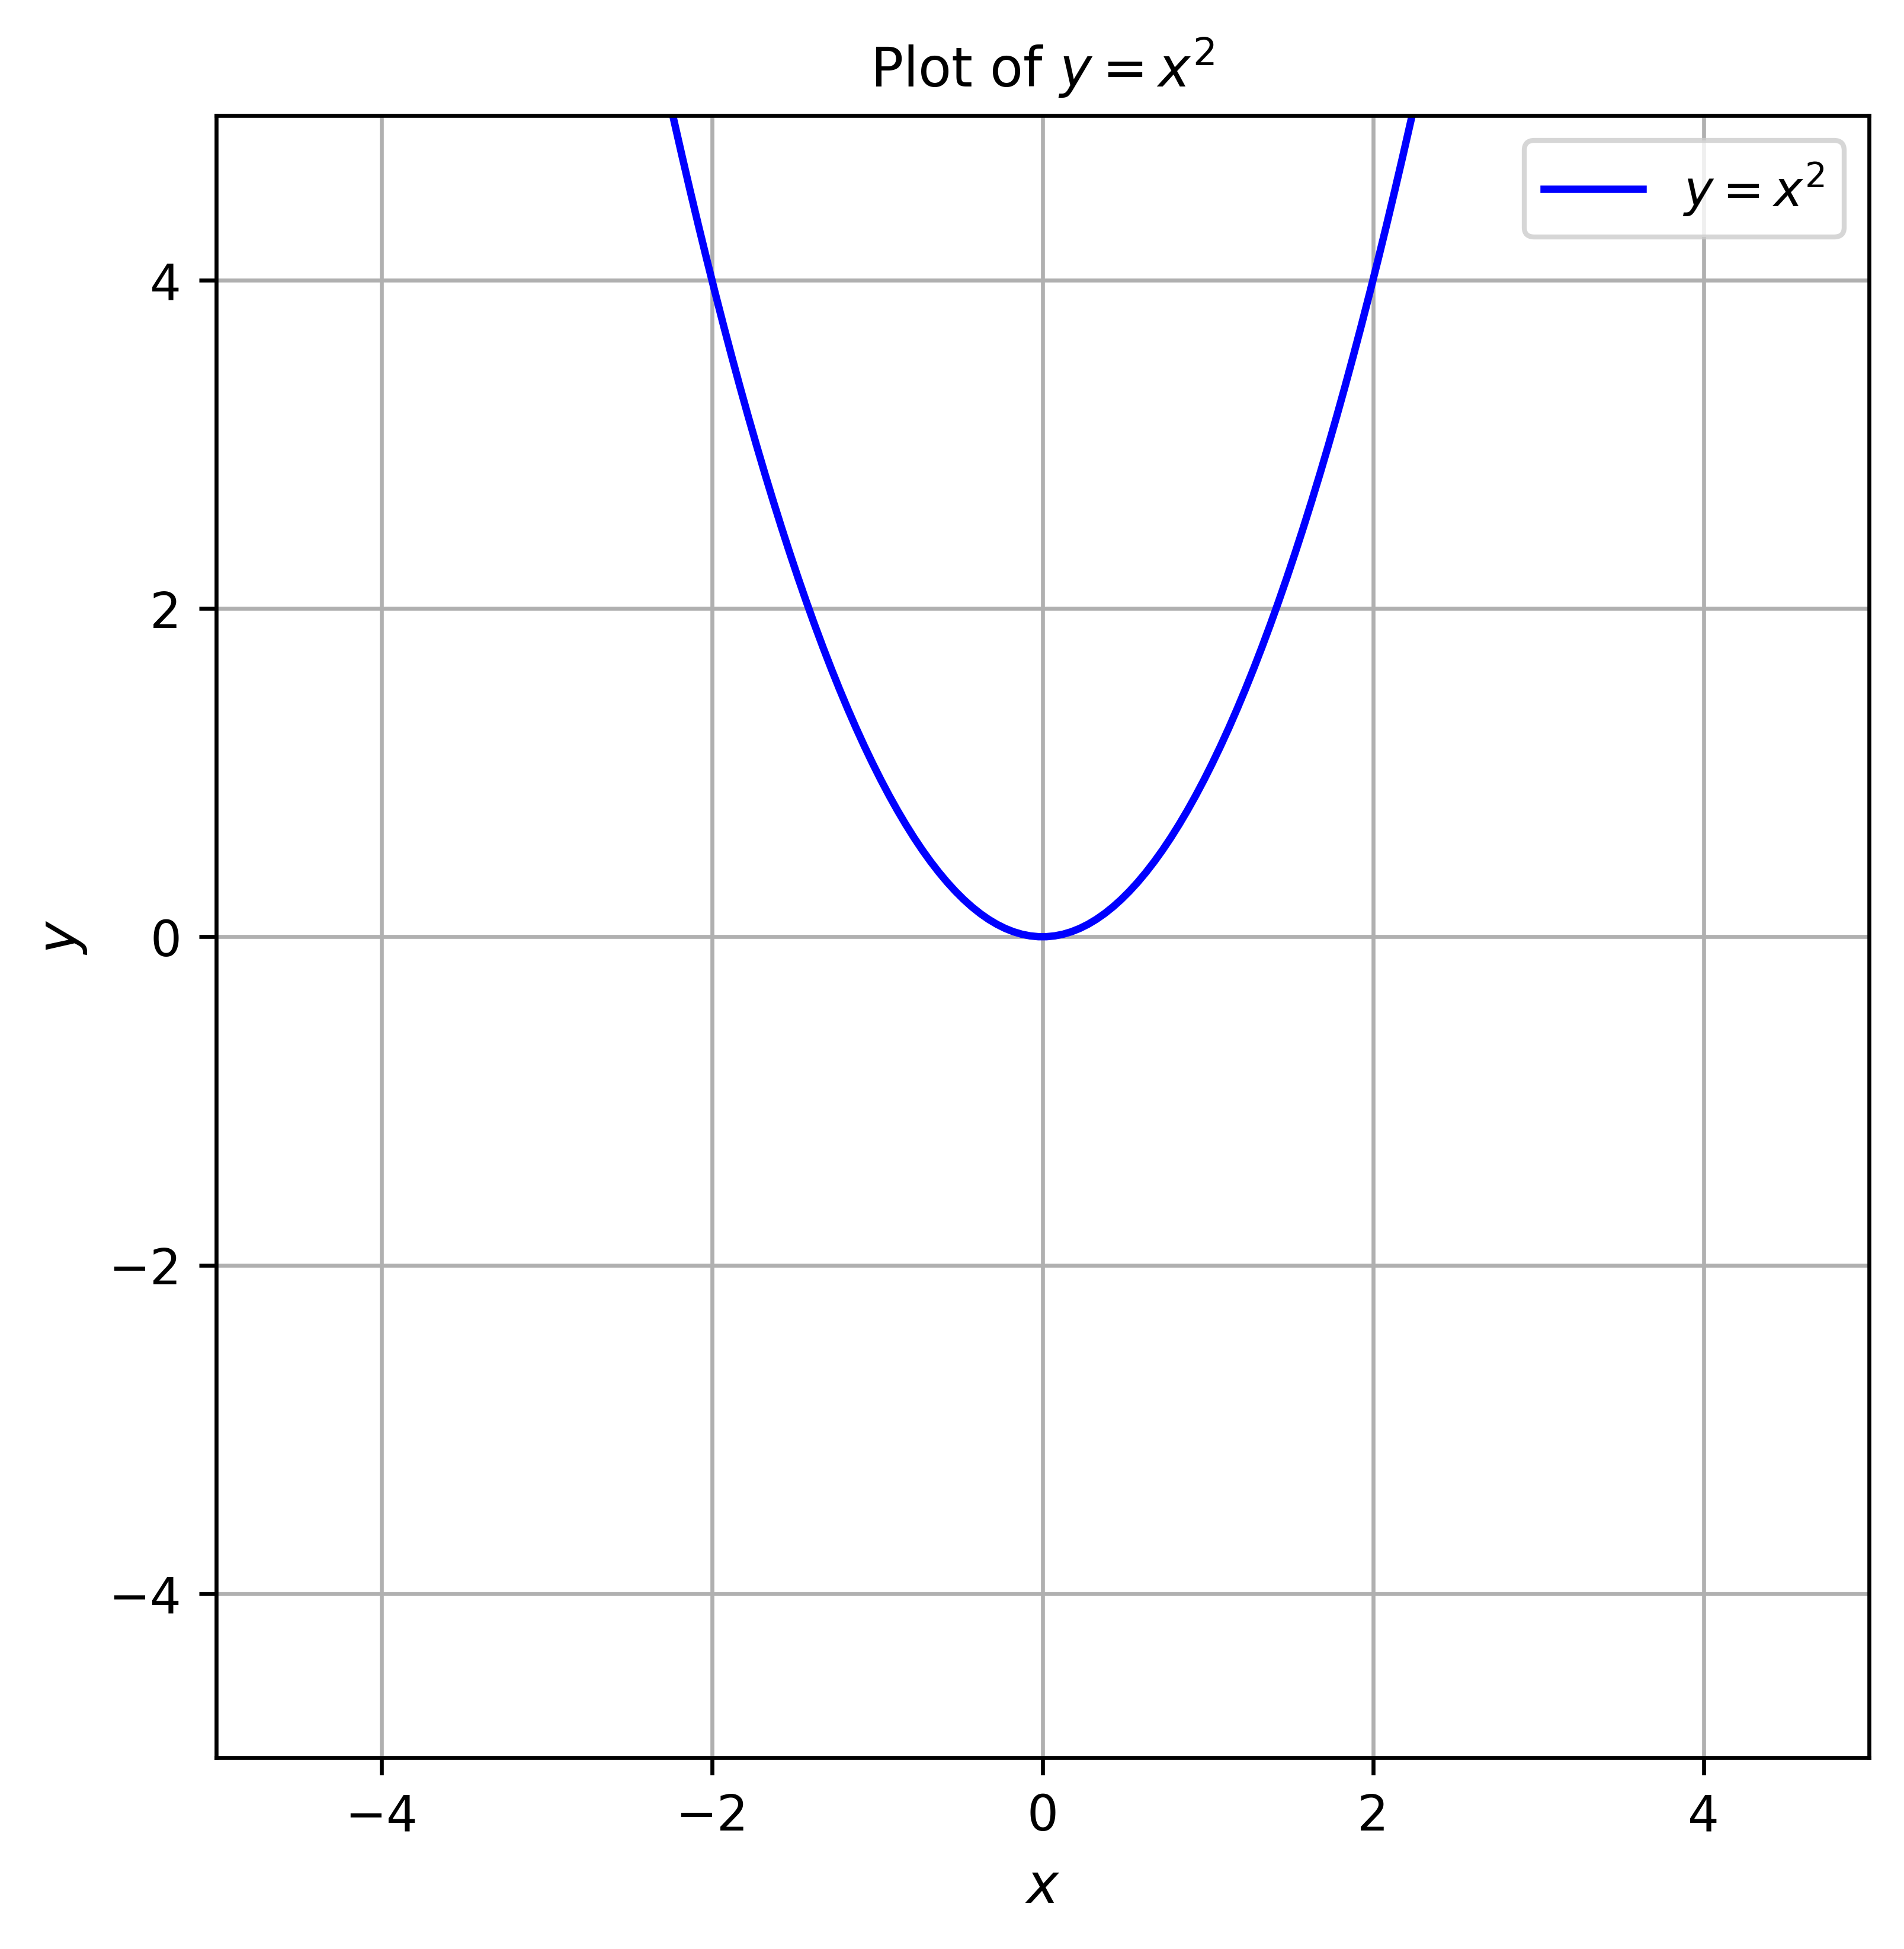
아래 최소 예제는 y = x2를 그리고 화면에 표시합니다.
# Basic packages
import numpy as np
import matplotlib.pyplot as plt

# function
def f(x):
    return x**2

# domain
x = np.linspace(-10, 10, 400)

# visualization
fig, ax = plt.subplots(figsize=(6, 6))
ax.plot(x, f(x), label="$y = x^2$", color="blue")
plt.show()
전체 예제
아래 예제는 y = x2를 그리고, .py 파일 옆에 figures 폴더를 만든 뒤 figure를 저장하고 화면에 표시합니다.
# Basic packages
import numpy as np
import matplotlib.pyplot as plt
from pathlib import Path

# save path setting
script_dir = Path(__file__).resolve().parent
figures_dir = script_dir / "figures"
figures_dir.mkdir(exist_ok=True)

# function
def f(x):
    return x**2

# domain
x = np.linspace(-10, 10, 400)

# visualization
fig, ax = plt.subplots(figsize=(6, 6))
ax.plot(x, f(x), label="$y = x^2$", color="blue")
ax.set_xlabel("$x$", fontsize=11)
ax.set_ylabel("$y$", fontsize=11)
ax.set_xlim(-5, 5)
ax.set_ylim(-5, 5)
ax.tick_params(labelsize=10)
ax.grid()
ax.legend()
ax.set_title("Plot of $y = x^2$", fontsize=11)

figure_path = figures_dir / "figure-1.png"
fig.savefig(figure_path, dpi=600, bbox_inches="tight")
plt.show()
이 script는 figure를 .py 파일 옆의 figures/figure-1.png로 저장합니다. 이렇게 두면 생성된 figure가 해당 script와 가까운 위치에 남습니다.
생성된 figure는 다음처럼 보입니다.