Visualization 1
Two dimensions
Two-dimensional plots are the default way to inspect trends, comparisons, and numerical output.
Install required library
If Matplotlib is not installed, install it first.
On Windows PowerShell:
py -m pip install matplotlib
On macOS or Linux:
python3 -m pip install matplotlib
Minimal example
This minimal example plots y = x2 and shows it.
# Basic packages
import numpy as np
import matplotlib.pyplot as plt

# function
def f(x):
    return x**2

# domain
x = np.linspace(-10, 10, 400)

# visualization
fig, ax = plt.subplots(figsize=(6, 6))
ax.plot(x, f(x), label="$y = x^2$", color="blue")
plt.show()
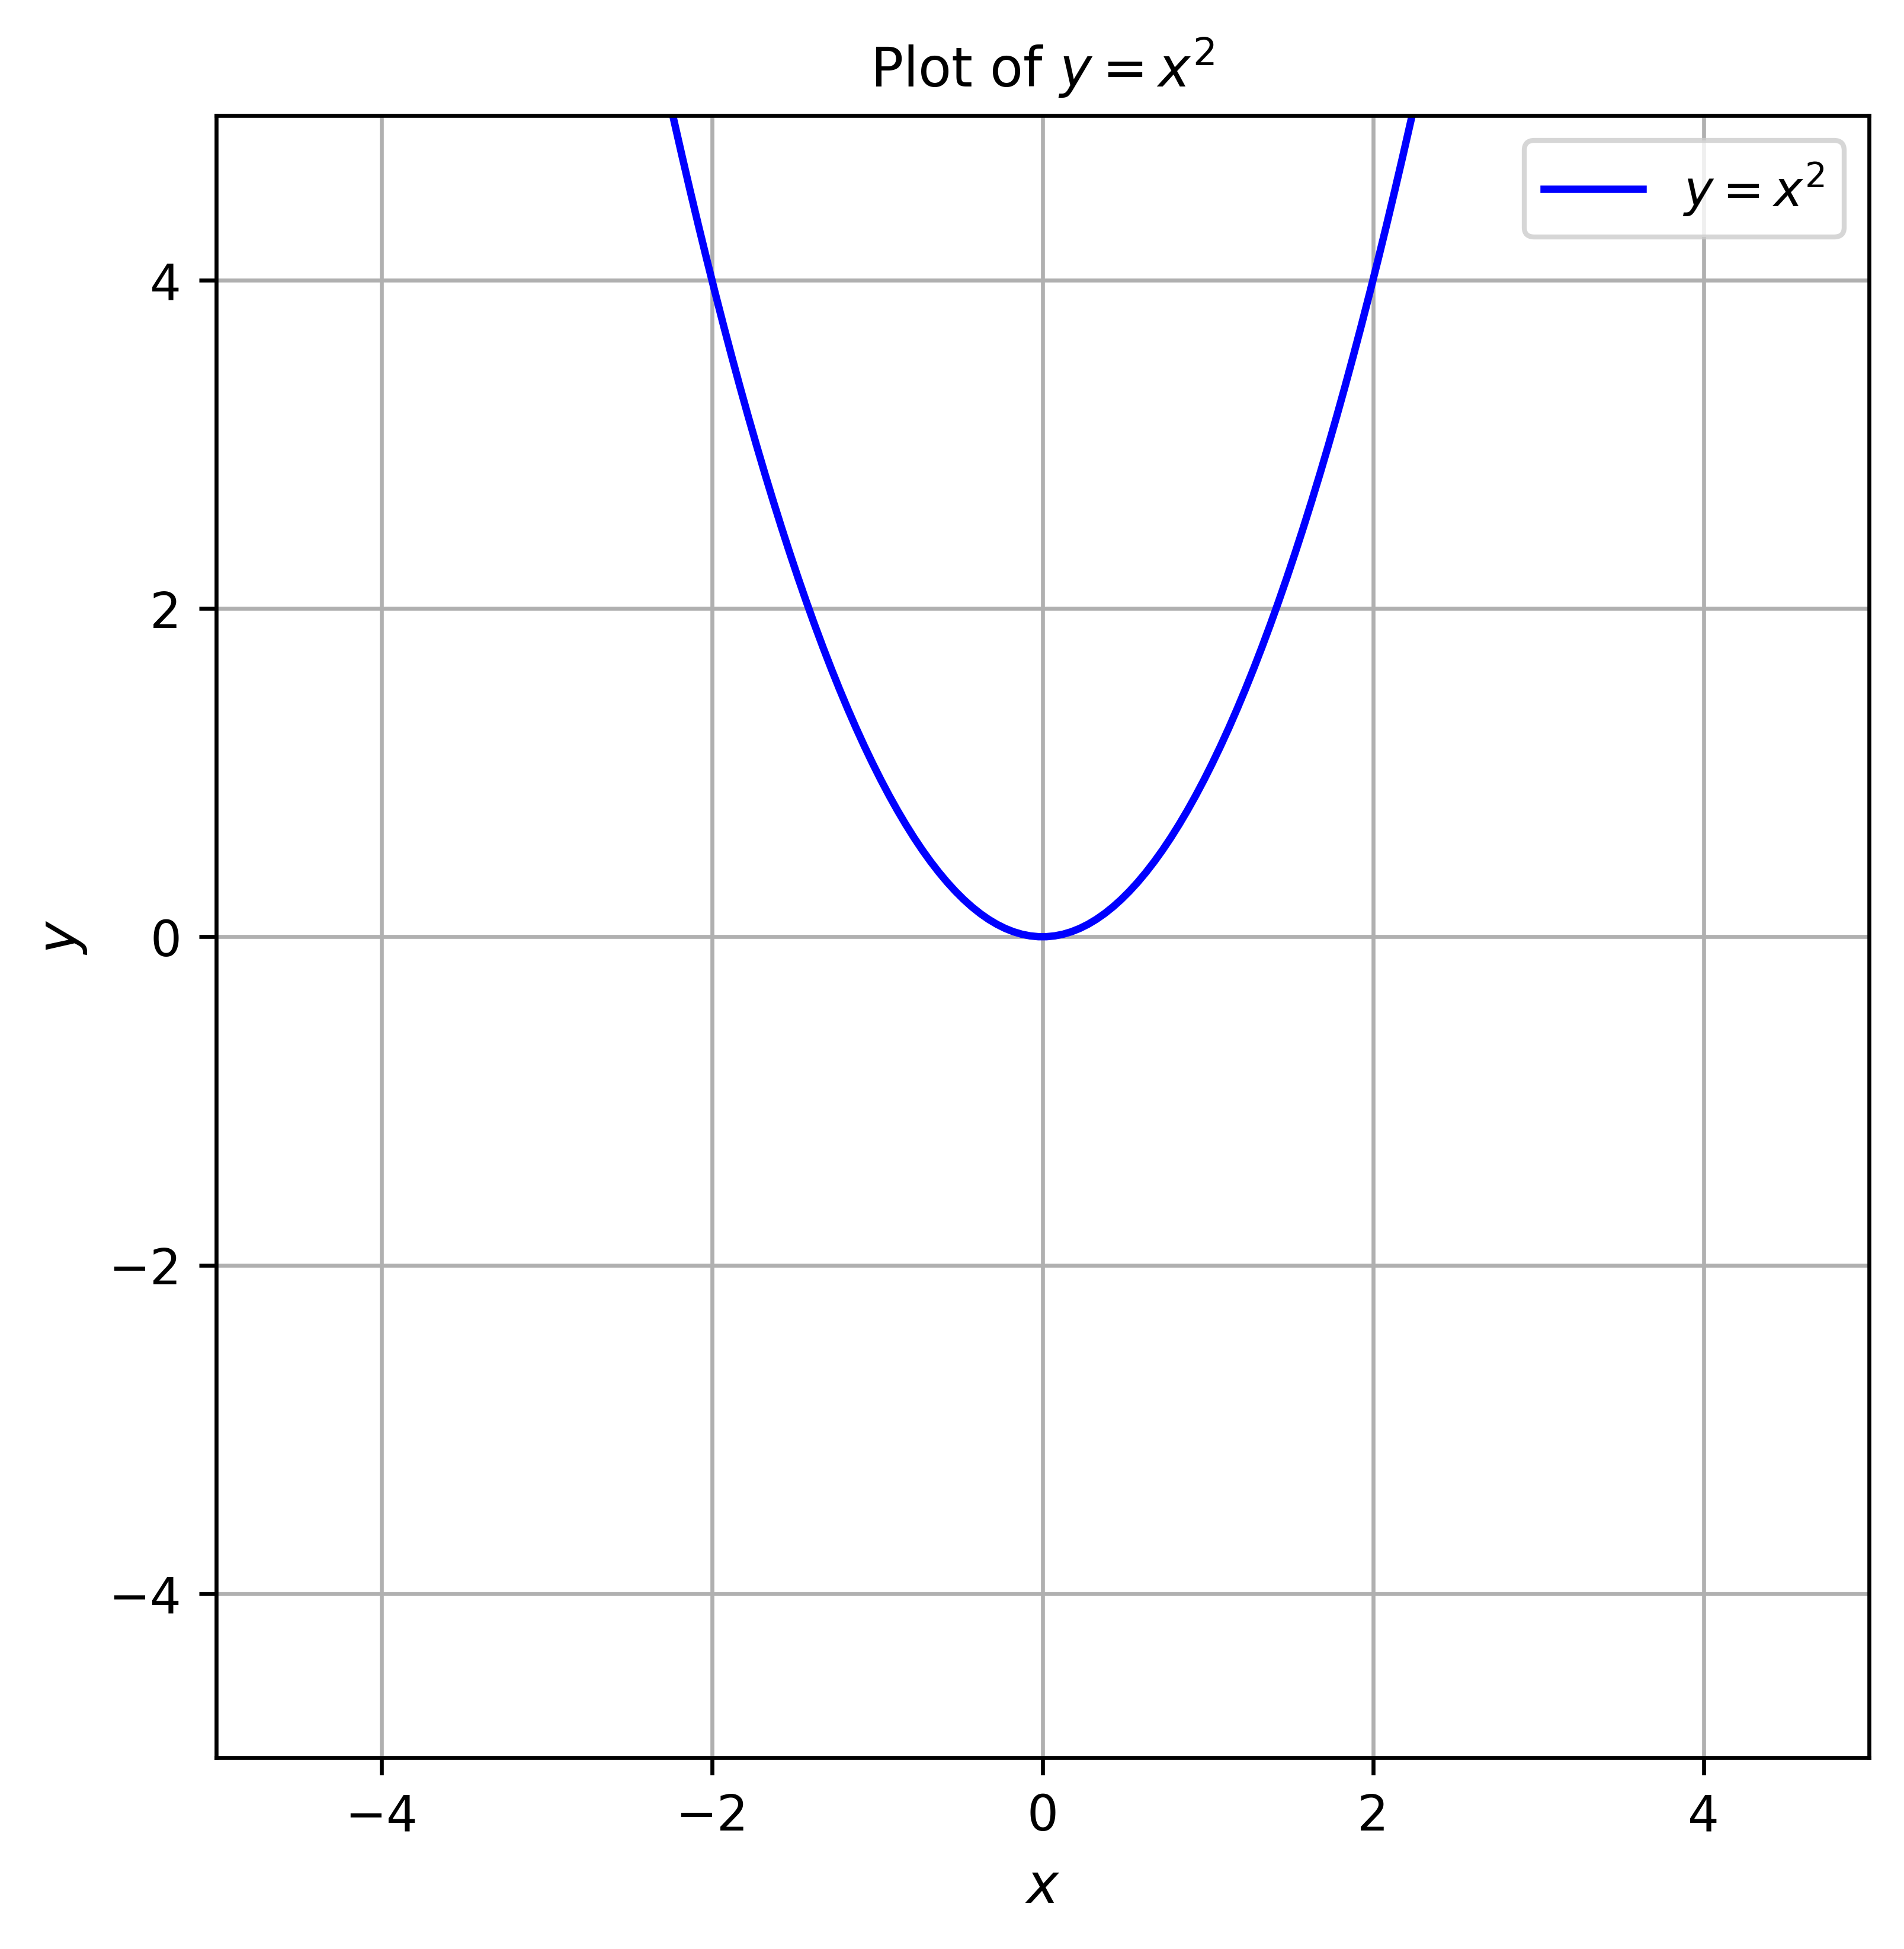
Complete example
This example plots y = x2, creates a figures folder next to the .py file, saves the figure, and then shows it.
# Basic packages
import numpy as np
import matplotlib.pyplot as plt
from pathlib import Path

# save path setting
script_dir = Path(__file__).resolve().parent
figures_dir = script_dir / "figures"
figures_dir.mkdir(exist_ok=True)

# function
def f(x):
    return x**2

# domain
x = np.linspace(-10, 10, 400)

# visualization
fig, ax = plt.subplots(figsize=(6, 6))
ax.plot(x, f(x), label="$y = x^2$", color="blue")
ax.set_xlabel("$x$", fontsize=11)
ax.set_ylabel("$y$", fontsize=11)
ax.set_xlim(-5, 5)
ax.set_ylim(-5, 5)
ax.tick_params(labelsize=10)
ax.grid()
ax.legend()
ax.set_title("Plot of $y = x^2$", fontsize=11)

figure_path = figures_dir / "figure-1.png"
fig.savefig(figure_path, dpi=600, bbox_inches="tight")
plt.show()
The script saves the figure as figures/figure-1.png next to the .py file. This keeps generated figures close to the script that created them.
The resulting figure should look like this.